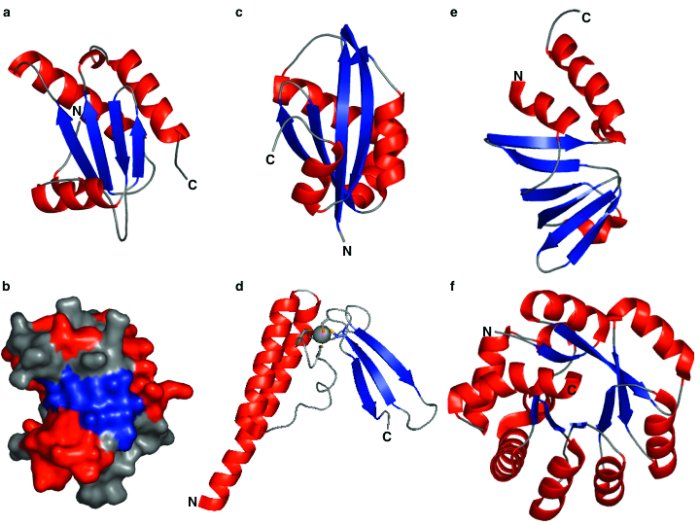
Figure 4. Tertiary structures of bacterial (panels a and b) and archaeal RPPs (panels c–f). Ribbon representation and surface map of the protein subunit of B. subtilis RNase P (panels a and b; PDB 1A6F; Stams et al. 1998). Ribbon diagrams of P. furiosus Pop5 (panel c; PDB ID 2AV5; Wilson et al. 2006), P. horikoshii Rpp21 (panel d; PDB ID 1X0T; Kakuta et al. 2005); A. fulgidus Rpp29 (panel e; PDB ID 1TS9; Sidote et al. 2004); and P. horikoshii Rpp30 (panel f; PDB ID 1V77; Takagi et al. 2004). In panel d, the gray sphere and the orange sticks indicate the zinc ion and the Cys side chains to which it is liganded. PYMOL was used to generate the images (www.pymol.org).